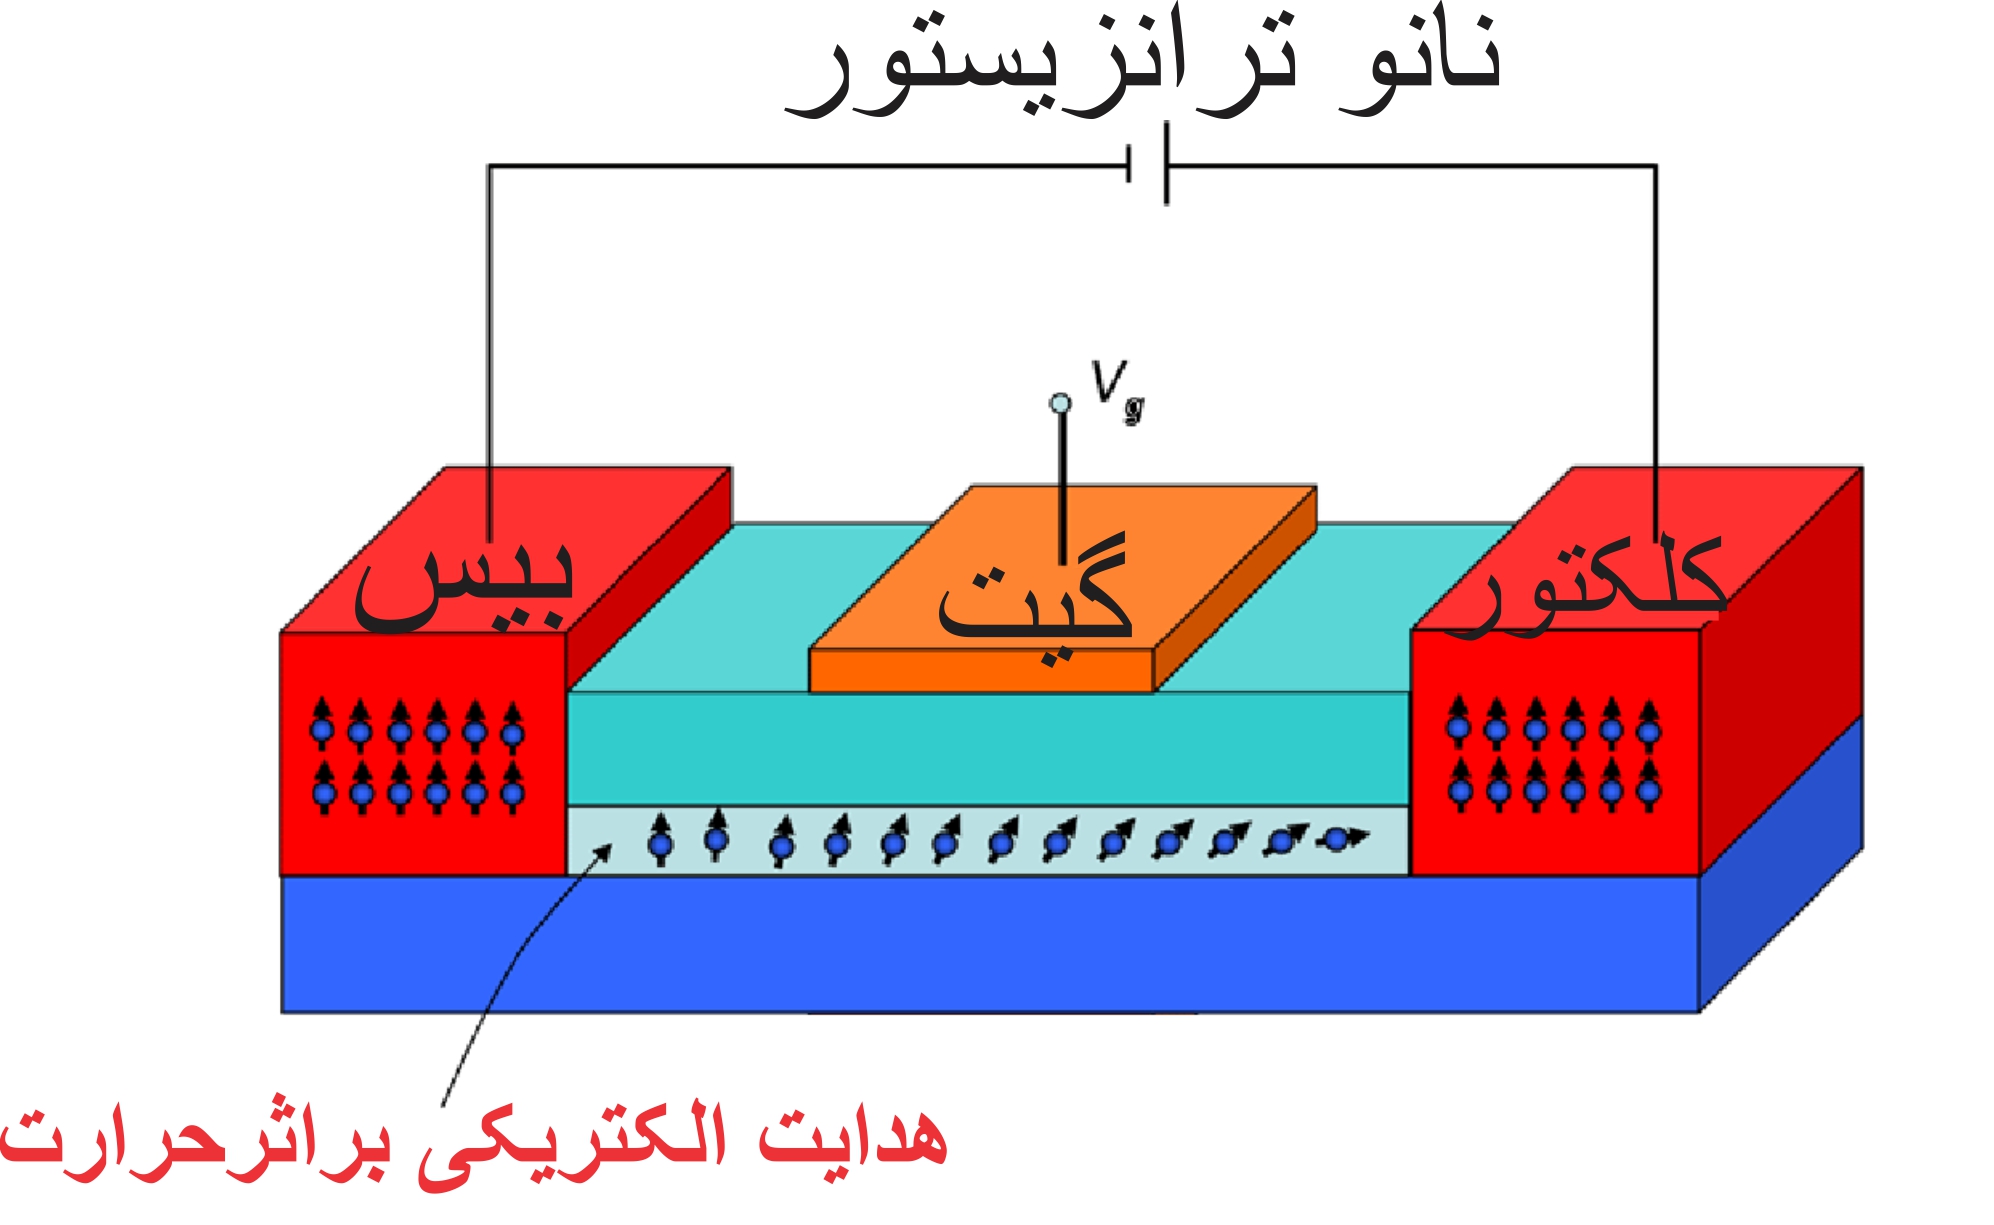
Field Effect Nano Transistors (Nano Teransistor Mosfet)
Propagation and evolution (field effect nanotransistors) results from laboratory experiments
Researcher and author: Dr. ( Afshin Rashid)
Note: For the production and reproduction of nanotransistors at different temperatures, it has different values, it is shown as a function of temperature and in the form of (T(λ). Starting from low temperatures and gradually increasing the temperature, it can be seen that the value of T(λ ) reaches a maximum value of 111.3 mK/W near the temperature of 011 K (this maximum can be seen as a peak in the graph) and then decreases with increasing temperature . For the reproduction and development of nanotransistors, there are High thermal conductivity for single thermal nanotubes has been shown theoretically. The results of laboratory experiments also indicate the presence of this feature in mass samples of single-walled carbon nanotubes as well as for single-walled multi-walled nanotubes.
The thermal conductivity of single carbon nanotubes has been measured by computational methods. One group was single-walled carbon nanotubes that were placed together as a mass, and the thermal conductivity value of their collection was obtained. One group was multi-walled carbon nanotubes that were placed separately from each other . The thermal conductivity of this batch of nanotubes was investigated separately. They obtained the value of thermal conductivity of more than 011 mK/W for single-walled carbon nanotubes. Also, according to this, the thermal conductivity of multi-walled carbon nanotubes individually is more than 300 mK/W.
The gradual increase in temperature in the nano-carbon inside the nano-transistor (picture above)
Since the structure of carbon nanotubes has different values for the production and reproduction of nanotransistors at different temperatures, it is shown as a function of temperature in the form of T(λ). Starting from low temperatures and gradually increasing the temperature It can be seen that the value of T(λ ) reaches a maximum value of 111.3 mK/W near the temperature of 011 K (this maximum can be seen as a peak in the graph) and then decreases with increasing temperature . The maximum value (T) λ, which has been observed so far in the investigations, is related to a special nano heat pipe sample that was measured at a temperature of 010 K. This value is equal to 00111 mk/W. Therefore, the value of (T) λ nano The carbon tube at its maximum is comparable to the highest value of (T) λ that has been measured so far. According to the presented diagram, even at room temperature, the thermal conductivity of the nanotube carbon is very high and is equal to 0011 mK/W, in the methods of reproduction of nanotransistors and nanotubes with the synthesis of carbon nanotubes based on the catalytic chemical vapor deposition (CCVD) including the decomposition of the carbon source on small metal particles or clusters as a catalyst This method of reproduction of nanotransistors includes heterogeneous and homogeneous process. The metals used for these reactions are transition metals , such as iron, cobalt, and nickel. Compared to electric arc discharge and laser ablation, carbon nanotubes are generally formed at a lower temperature of about 011 to 0111 degrees. Generally, the selectivity of this method is higher for the production of multi-walled carbon nanotubes. Both homogeneous and heterogeneous processes are very sensitive to the nature and structure of the catalyst used in addition to the operating conditions. Production of carbon nanotubes compared to the electric arc method, they have more length (several tens to hundreds of micrometers) and defects. The major drawback of nanotubes is due to the use of lower temperatures compared to the electric arc method, which does not allow any structural rearrangement.
Conclusion :
Since the structure of carbon nanotubes has different values for the production and reproduction of nanotransistors at different temperatures, it is shown as a function of temperature in the form of T(λ). Starting from low temperatures and gradually increasing the temperature It can be seen that the value of T(λ ) reaches a maximum value of 111.3 mK/W near the temperature of 011 K (this maximum can be seen as a peak in the graph) and then decreases with increasing temperature .
Researcher and author: Dr. ( Afshin Rashid)
Specialized doctorate in nano-microelectronics


